What if we could analyze the risk levels of different vendors and predict challenges before they happen?
We have partnered with Supply Dynamics to create a supply chain risk analysis tool that allows companies to view vendors, products, risks, and actionable recommendations. Our tool looks at the bigger picture, looking into all possible risks in the supply chain.

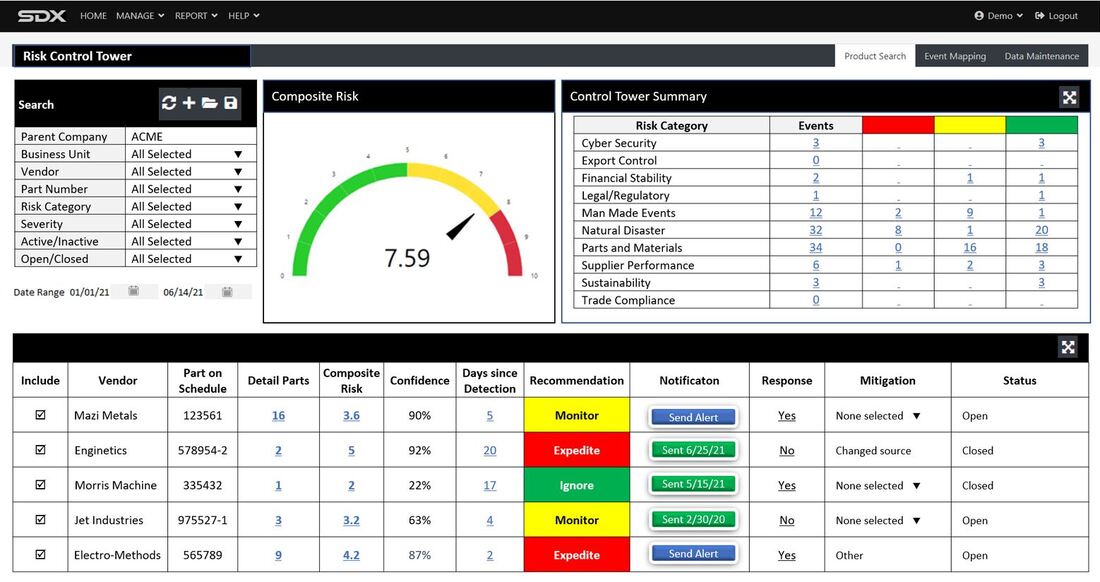
Our supply chain risk analysis tool provides companies with a comprehensive interface called the ‘Risk Control Tower’. The Risk Control Tower functions as a one-stop-shop where vendor data has been compiled, analyzed, and presented in an easy-to-understand format.
The Risk Control Tower provides a search tool, composite risk dial, a control tower summary, and a risk overview with actionable recommendations and solution status tracking.
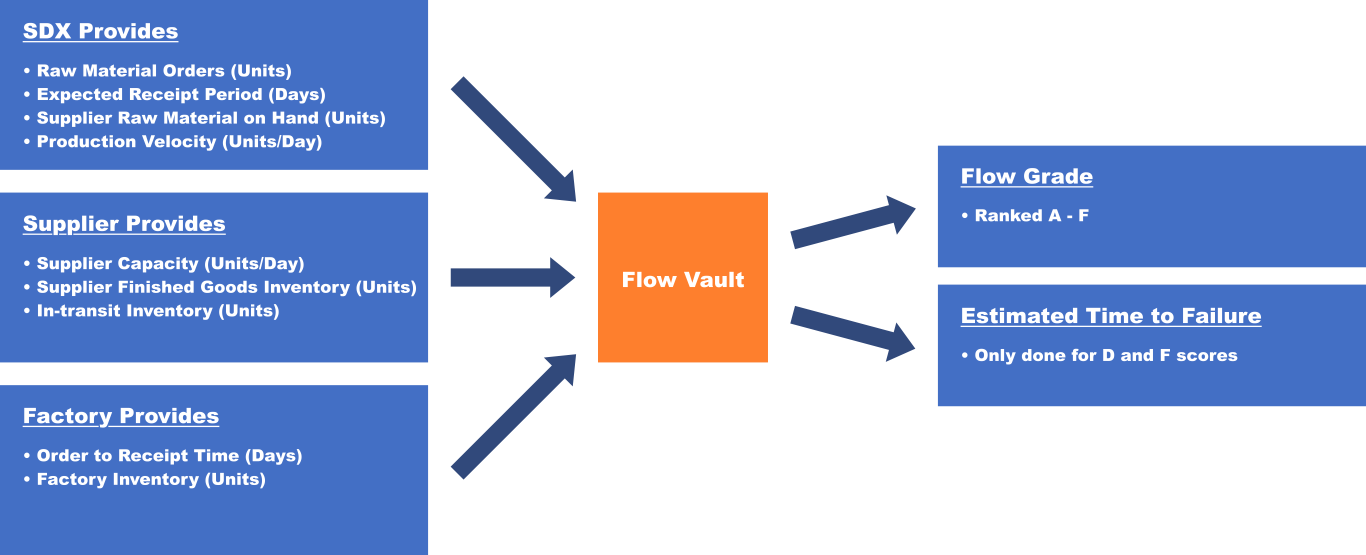
Our tool pulls in data from the company, suppliers, and factories to create a flow vault. From this, our tool assigns a flow grade (A - F) and an estimated time to failure (for D and F scores). This information is provided in the Risk Control Tower so that a company has time to plan for possible future failures, and work around and prevent future challenges.
Below is a flowchart that depicts the flow of information into our supply chain risk analysis solution, and how the information is used to label risk factors.
The Risk Control Tower provides a search tool, composite risk dial, a control tower summary, and a risk overview with actionable recommendations and solution status tracking.
Our tool pulls in data from the company, suppliers, and factories to create a flow vault. From this, our tool assigns a flow grade (A - F) and an estimated time to failure (for D and F scores). This information is provided in the Risk Control Tower so that a company has time to plan for possible future failures, and work around and prevent future challenges.
Below is a flowchart that depicts the flow of information into our supply chain risk analysis solution, and how the information is used to label risk factors.
Our tool looks at 66 unique risk factors and does the math for you. These risk factors include
By calculating and assigning labels to all of the individual risk factors for the supply chain, it allows us to provide you with both the bigger picture and the intricate details of the supply chain status.
- Factory disruptions;
- Cyber security challenges;
- Conflict minerals;
- Mergers and acquisitions;
- Parts shortages;
- Earthquakes;
- Recalls, and more.
By calculating and assigning labels to all of the individual risk factors for the supply chain, it allows us to provide you with both the bigger picture and the intricate details of the supply chain status.

With a project built on data, what happens when our risk model has increasing amounts of missing data to work with?
In a perfect world, we would have 100% of the data that we need at any given time. Random data sparseness is inevitable. Our supply chain risk analysis tool tracks 66 factors, and any one of them could be missing at any particular time. Sometimes, data providers go offline or are missing data for one reason or another. It is possible for us to lose an entire category of data at a time.
There are two ways to set off alarms, increasing risk score and based upon trigger variables. We found that in order for data sparseness to have a significant negative impact on our model, it has to affect both mechanisms simultaneously.
Random sparseness has difficulty beating the triggers. The more significant the event, the more triggers have to be defeated by having their data go missing. The more significant the event, the more triggers get tripped and the more data that would have to go missing before the system fails to notice an issue.
Categorical data sparseness has difficulty beating the risk scoring. Losing an entire category can zero out that contribution to the top-level risk score, but the other categories are not necessarily affected since they come from different diverse data sources. By not having all the data collecting eggs in one basket, we ensure we always get some risk signaling even when multiple categories fail.
If we encounter enough missing data, we can blind the risk modeling system. Because we designed it to minimize false alarms, it can be squelched by missing data. But it takes a lot of misses before the system performance is seriously impacted.

Our supply chain risk analysis tool takes the worry out of late deliveries and supply chain issues. It empowers your company to stay one step ahead, and be proactive rather than reactive.
Instead of needing to manually track each of the 66 risk factors that we assess, you can look at the overall big picture and focus only on the small details that matter. Our supply chain risk analysis tool will save you time and money and will only get more effective with time.
Instead of needing to manually track each of the 66 risk factors that we assess, you can look at the overall big picture and focus only on the small details that matter. Our supply chain risk analysis tool will save you time and money and will only get more effective with time.

Our supply chain risk analysis tool provides companies with a comprehensive interface called the ‘Risk Control Tower’. The Risk Control Tower functions as a one-stop-shop where vendor data has been compiled, analyzed, and presented in an easy-to-understand format.
The Risk Control Tower provides a search tool, composite risk dial, a control tower summary, and a risk overview with actionable recommendations and solution status tracking.
Our tool pulls in data from the company, suppliers, and factories to create a flow vault. From this, our tool assigns a flow grade (A - F) and an estimated time to failure (for D and F scores). This information is provided in the Risk Control Tower so that a company has time to plan for possible future failures, and work around and prevent future challenges.
Below is a flowchart that depicts the flow of information into our supply chain risk analysis solution, and how the information is used to label risk factors.

Our tool looks at 66 unique risk factors and does the math for you. These risk factors include
By calculating and assigning labels to all of the individual risk factors for the supply chain, it allows us to provide you with both the bigger picture and the intricate details of the supply chain status.
- Factory disruptions;
- Cyber security challenges;
- Conflict minerals;
- Mergers and acquisitions;
- Parts shortages;
- Earthquakes;
- Recalls, and more.
By calculating and assigning labels to all of the individual risk factors for the supply chain, it allows us to provide you with both the bigger picture and the intricate details of the supply chain status.

With a project built on data, what happens when our risk model has increasing amounts of missing data to work with?
In a perfect world, we would have 100% of the data that we need at any given time. Random data sparseness is inevitable. Our supply chain risk analysis tool tracks 66 factors, and any one of them could be missing at any particular time. Sometimes, data providers go offline or are missing data for one reason or another. It is possible for us to lose an entire category of data at a time.
There are two ways to set off alarms, increasing risk score and based upon trigger variables. We found that in order for data sparseness to have a significant negative impact on our model, it has to affect both mechanisms simultaneously.
Random sparseness has difficulty beating the triggers. The more significant the event, the more triggers have to be defeated by having their data go missing. The more significant the event, the more triggers get tripped and the more data that would have to go missing before the system fails to notice an issue.
Categorical data sparseness has difficulty beating the risk scoring. Losing an entire category can zero out that contribution to the top-level risk score, but the other categories are not necessarily affected since they come from different diverse data sources. By not having all the data collecting eggs in one basket, we ensure we always get some risk signaling even when multiple categories fail.
If we encounter enough missing data, we can blind the risk modeling system. Because we designed it to minimize false alarms, it can be squelched by missing data. But it takes a lot of misses before the system performance is seriously impacted.
In a perfect world, we would have 100% of the data that we need at any given time. Random data sparseness is inevitable. Our supply chain risk analysis tool tracks 66 factors, and any one of them could be missing at any particular time. Sometimes, data providers go offline or are missing data for one reason or another. It is possible for us to lose an entire category of data at a time.
There are two ways to set off alarms, increasing risk score and based upon trigger variables. We found that in order for data sparseness to have a significant negative impact on our model, it has to affect both mechanisms simultaneously.
Random sparseness has difficulty beating the triggers. The more significant the event, the more triggers have to be defeated by having their data go missing. The more significant the event, the more triggers get tripped and the more data that would have to go missing before the system fails to notice an issue.
Categorical data sparseness has difficulty beating the risk scoring. Losing an entire category can zero out that contribution to the top-level risk score, but the other categories are not necessarily affected since they come from different diverse data sources. By not having all the data collecting eggs in one basket, we ensure we always get some risk signaling even when multiple categories fail.
If we encounter enough missing data, we can blind the risk modeling system. Because we designed it to minimize false alarms, it can be squelched by missing data. But it takes a lot of misses before the system performance is seriously impacted.

Our supply chain risk analysis tool takes the worry out of late deliveries and supply chain issues. It empowers your company to stay one step ahead, and be proactive rather than reactive.
Instead of needing to manually track each of the 66 risk factors that we assess, you can look at the overall big picture and focus only on the small details that matter. Our supply chain risk analysis tool will save you time and money and will only get more effective with time.
Instead of needing to manually track each of the 66 risk factors that we assess, you can look at the overall big picture and focus only on the small details that matter. Our supply chain risk analysis tool will save you time and money and will only get more effective with time.
|
We are seeking qualified external investors interested in supporting our supply chain risk analysis project.
Click the button to get in touch with us today! |

|